3.0 The Concept of a Cause Systems of Variation
Part III. Cause Systems of Variation
The fundamental concept underlying the VAS methodology is the notion of a “cause system of variation”. Data encountered in applied research are usually created by complex causes of variation. By a cause system of variation we simply mean the set of known, and unknown, “causes” producing the variation observed in the empirical data forming the basis for the analysis. In any given application there are several “sources” of the causes of variation, and two important “types” of causes of variation, that are simultaneously at work creating the variation in the observed data.
3.1 The Three Interrelated Cause Systems of Variation
There are always three interrelated cause systems of variation that work together to produce the empirical data forming the basis for the analysis.
These three sources of variation are the:
primary cause system
sampling cause system
measurement cause system.
3.1.1 The Primary Cause System
The primary cause system is the actual physical or social process under study. For example, in manufacturing settings the primary cause system is the actual manufacturing process. In an insurance setting, the primary cause system might be the policy renewal process. The primary cause system, and its associated causes of variation, are most important to the analyst.
3.1.2 The Sampling Cause System
In many applications we only obtain samples of output from the primary cause system. For example consider a manufacturing process that produces daily production lots of 20,000 light bulbs. Each day we may select a sample of size N = 100 light bulbs from the production lot to be tested for defects. If we were to select multiple samples of size N=100 from the same production lot, the test results would vary from sample to sample. Therefore, in addition to the variation produced by the manufacturing process which is the primary cause system, additional variation is introduced in the data by causes of variation associated with the sampling process.
It is important to note that it is often assumed that the sample data are collected using a “statistical sample”. But if the sampling process is not operationally executed according to the rules dictated by deductively valid statistical sampling theory, the sampling process can introduce significant “biases”, and unmeasurable uncertainty, in the sample data. [19]
In some applications the sample is actually a 100% census. That is, every unit produced by the primary cause system is included in the sample. In that case the variation due to the sampling process is completely eliminated from the data.
3.1.3 The Measurement Cause System
And finally, in all applications the data are created by some type of measurement process applied to components of the process or to the production units contained in the sample. Measurement systems are subject to causes of variation that can create bias and variation in the data forming the basis for the analysis. The variation introduced by the measurement process becomes evident in applications where we can make repeated measurements on the same unit of analysis. Therefore the act of measuring critical characteristics relevant to the process, or on the units produced by the primary cause system and selected into the sample, adds a third source of variation into the mix affecting the observed data.
In practice the goal is to control the sampling and measurement processes so that the variation they produce in the response variable is negligible compared to the variation introduced by the primary cause system.
3.2 The Two Fundamental Types of Causes of Variation
The second important component of the model of cause systems of variation involves the nature of the variation created by the causes of variation. Not all causes of variation are of the same type with respect to the nature of variation they produce in the response variable. There are two fundamental types of causes of variation, and they produce different types of variation. The two fundamental types of causes of variation are:
assignable causes of variation, and
common causes of variation.
3.2.1 Assignable Causes and Explainable Variation
Assignable causes produce nonrandom patterns of variation that are “explainable” in the context of the application. Assignable causes may produce nonrandom patterns associated with deterministic and/or controlled stochastic variation that can be modeled mathematically. Or, they may produce uncontrolled variation that cannot be modeled mathematically and is therefore unpredictable. In some cases an assignable cause may be “ephemeral” or fleeting which is a completely unpredictable, singular event. But in all cases assignable causes are associated with explanations that may, or may not, be discoverable.
3.2.2 Common Causes and Unexplainable Variation
Common causes produce “unexplainable”, random variation. The effects of common causes cannot be predicted at the unit of analysis level, but their corporate behavior can be described by a statistical distribution. Common causes of variation produce controlled variation that is predictable at least within limits.
3.3 General and Constant Cause Systems of Variation
There are two types of cause systems of variation:
general cause systems of variation, and
constant cause systems of variation.
3.3.1 General Cause Systems of Variation
Systems of variation that involve a mixture of assignable and common causes of variation are referred to as “general cause systems of variation”.
3.3.2 Constant Cause Systems of Variation
Those systems of variation that are devoid of any significant assignable causes of variation are referred to as “constant cause systems of variation” because the sources and causes of the unexplained variation remain constant over time and space. In non-technical terms the data produced by constant cause systems are generated under “essentially the same conditions” in time and space.
Theoretically, the variation in a continuous response variable Y generated by a constant cause system of variation can be described by a statistical density function f where
Equation 3-1. The Statistical Density Function f
If the density function f were known, then theoretically any question regarding the variation associated with the response variable Y could be answered. But, as Dr. Shewhart pointed out, the density function is rarely, if ever, known in practice. [20]
3.4 The Concept of “Essential Information”
Unfortunately in practice we are rarely dealing with a constant cause system. And even if we are dealing with a constant cause system, we rarely know the exact form of the density function f. But Dr. Shewhart demonstrated that for constant cause systems the “essential information” about the density function f is captured by the distribution mean µ and the distribution standard deviation σ.[21] So the analysis of the variation in the response variable Y determined by the density function f focuses on the analysis of the behavior of the distribution mean and standard deviation.
3.5 The Shewhart Model of Cause Systems of Variation
Figure 3-1 presents the fundamental structure of the model of a cause system of variation that forms the basis for the VAS analysis methodology.
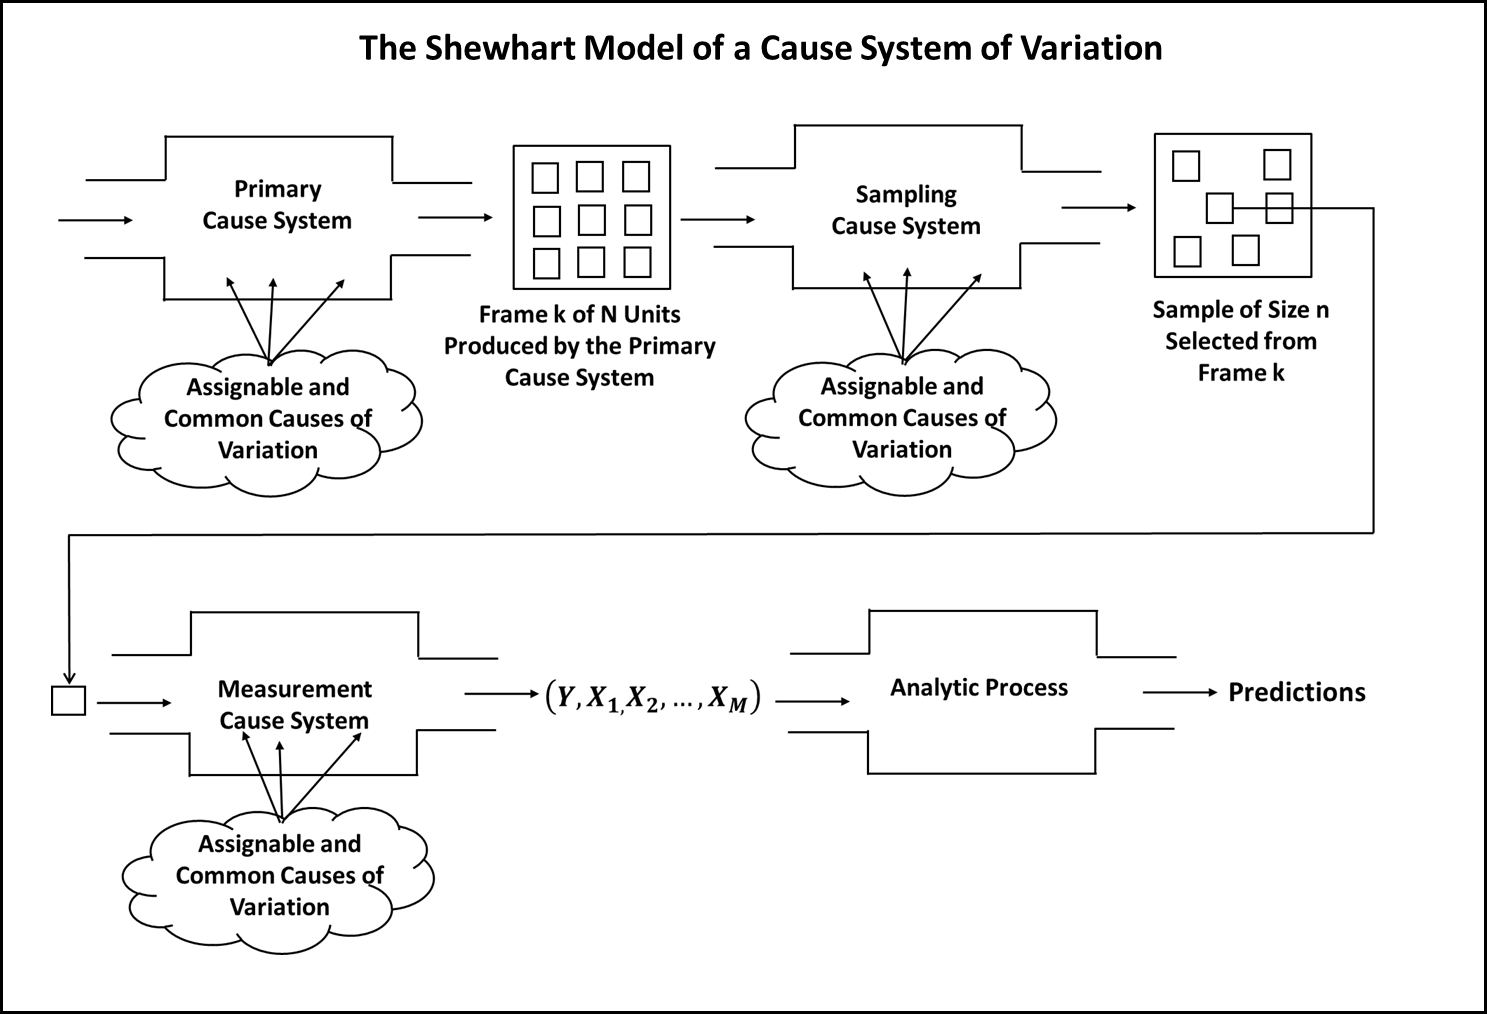
Figure 3-1. The Model of a Cause System of Variation
3.6 The Problem of Confounding
In practice we are almost always dealing with general cause systems of variation. In that case the assignable and common causes of variation associated with the primary, sampling and measurement cause systems are simultaneously at work producing the observed data forming the basis for the analyses. In statistical terms this mixing of causes of variation is referred to as “confounding”.
Confounding of assignable and common causes of variation is a serious practical problem with respect to the application of analytic methods that depend upon the assumption that certain statistics are calculated from data assumed to be produced by a constant cause system of variation. It is an important, but often difficult, inductive problem to determine if it is reasonable to believe that data produced by a combination of assignable and common causes of variation can serve as a basis for prediction. Stated another way, it is an important inductive problem to determine if the variation in the data is sufficiently “controlled” to form a basis for the development of a predictive model.
The important, practical question is: how do we separate the assignable and common causes of variation? Dr. Shewhart’s method of rational subgrouping discussed in detail in Chapter 5 deals with the problem of confounding. [22]
3.7
In practice the sample data are often not collected using a “statistical” sample, but rather the data come from transactional, observational studies, or convenience samples.
Assuming a specific form for the density function f does not make it so!
See pages 58 and 87 of Economic Control of Quality of Manufactured Product for a discussion of “Essential Information”.
For a detailed discussion of the method of rational subgrouping see Dr. Donald Wheeler’s book Understanding Statistical Process Control or Dr. Bishop’s book The Scientific Basis for Modern Analytic Practice.