20.0 Experimental Design Applications
Part X. Application to Experimental Design and Statistical Process Control
The analytical capabilities of Process Behavior extend to experimental design applications.[52] In this case the “process design factors” are the experimental variables under the control of the analyst that define the “experimental treatments” that may affect the response variable of interest. The production time variable defines the number of times that the experiment is “replicated”. If there is no “replication”, then there is no production time variable associated with the available data.
20.0.1 Example of a Single Factor Experiment
As an example of the analysis of an experiment using the Process Behavior capabilities consider the data in Table 20-1. The response variable is “coating weight”, the treatment group is taken as a type of coating material and there were N=4 observations per treatment group.[53] The process behavior charts produced by PB for the subgroup means and standard deviations are presented in Figure 20-1 and Figure 20-2. These charts indicate that Treatment Group 2 yields a detectably higher coating weight. The within subgroup variation appears to be comparable across the five treatment groups.
Table 20-1. Coating Weight Data
| Analysis of Coating Weight Data in Grams | ||||
|---|---|---|---|---|
| Treatment Group – Type of Coating Material | ||||
| 1 | 2 | 3 | 4 | 5 |
| 250 | 310 | 250 | 340 | 250 |
| 260 | 330 | 230 | 270 | 240 |
| 230 | 280 | 220 | 300 | 270 |
| 270 | 360 | 260 | 320 | 290 |
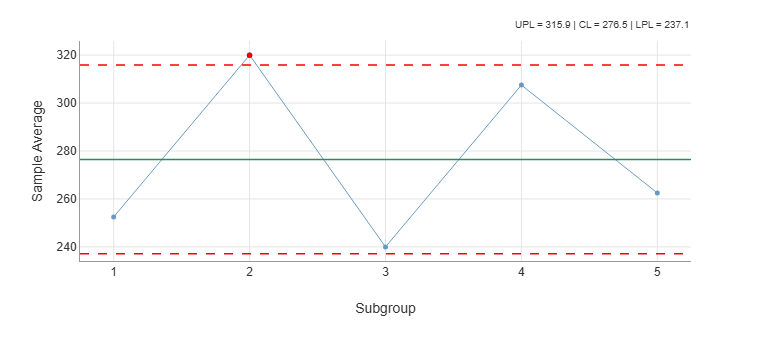
Figure 20-1. Xbar Chart for Coating Weight Data
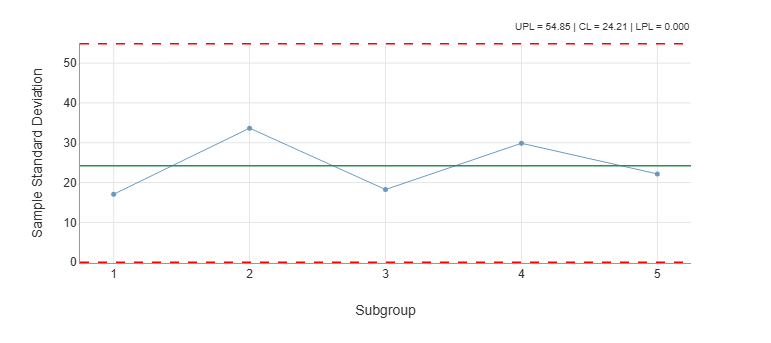
Figure 20-2. Standard Deviation Chart for Coating Weight Data
20.0.2 Example of a Multi-Factor Study
An experiment was conducted to study bacteria growth under several growth medium environments defined by Factor 1 – Type of Fatty Acid at 4 levels, Factor 2 – Isolate at 3 levels and Factor 3 – Concentration at 7 levels. A sample of N = 3 petri dishes were used under each experimental condition. A partial list of the data is presented in Table 20-2. The process behavior charts produced by Process Behavior are presented in Figure 20-3 through Figure 20-10 which gives a detailed analysis of the experimental design factors affecting both the average bacteria growth rate and the standard deviations associated with bacteria growth rate.
Table 20-2. Partial List of Bacteria Growth Data
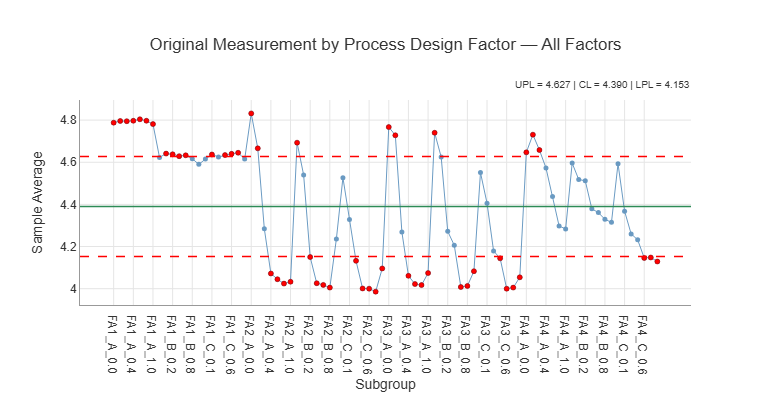
Figure 20-3. Xbar Chart for Bacteria Growth by the Experimental Treatments
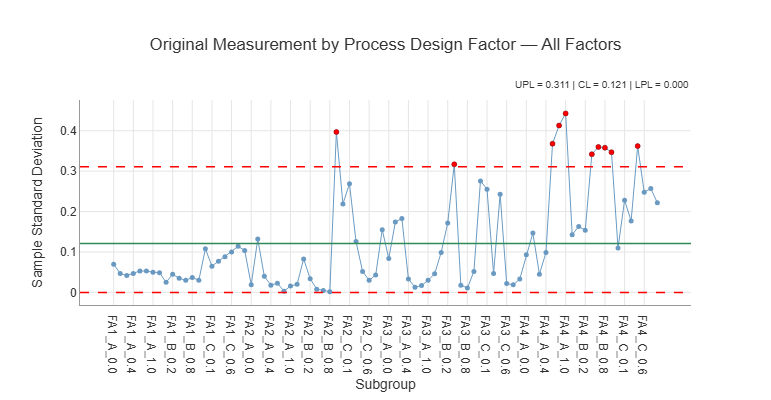
Figure 20-4. S Chart for Bacteria Growth by the Experimental Treatments
`
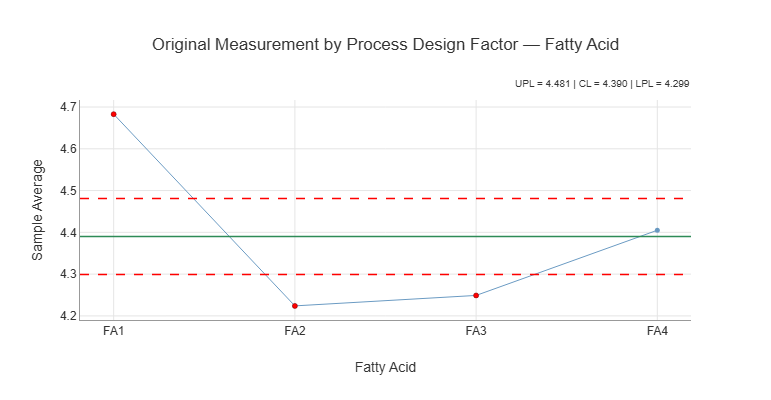
Figure 20-5. Xbar Chart for Fatty Acid Main Effects
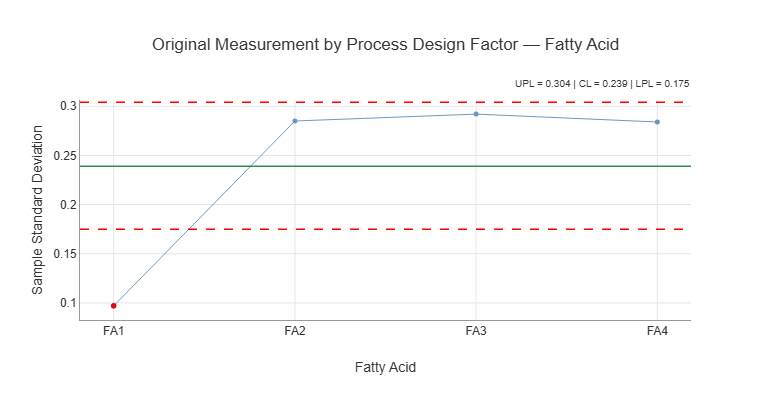
Figure 20-6. Standard Deviation Chart for Fatty Acid Effects
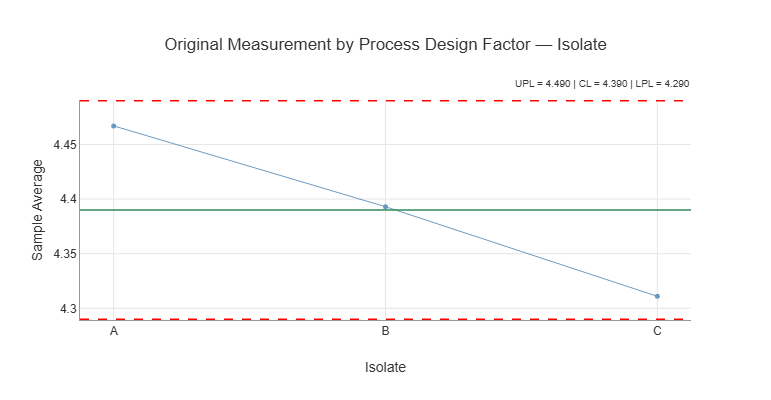
Figure 20-7. Xbar Chart for Isolate Main Effects
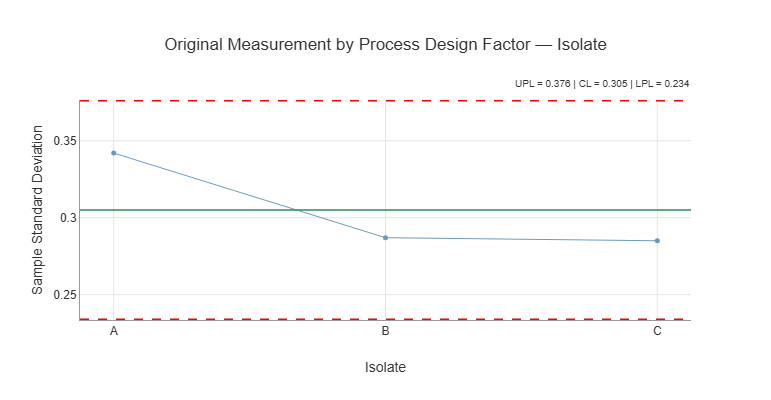
Figure 20-8. Standard Deviation Chart for Isolate Effects
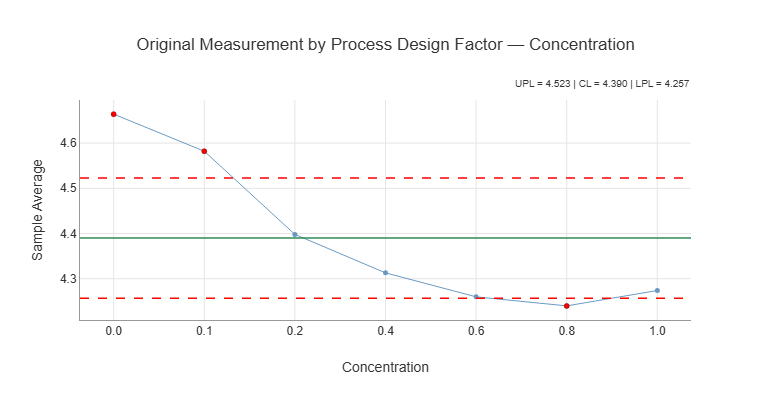
Figure 20-9. Xbar Chart for Concentration Main Effects
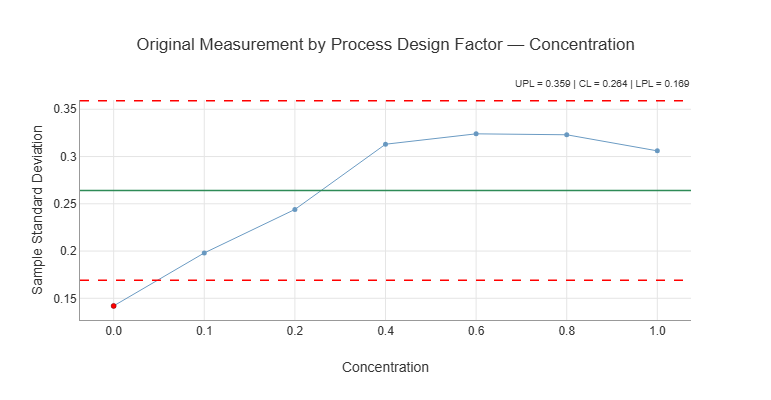
Figure 20-10. S Chart for Concentration Effects