7.0 The Structure of the Data Analyzed by VAS
The problem formulation described in the previous chapters leads directly to a standard structure for the data that form the basis for the VAS analyses. The structure applies whether the data are associated with physical or social science applications, or with a manufacturing, service or administrative process. It also applies whether the data are extracted from the process using a census, statistical sample, designed experiment, survey, transactional, observational study or a convenience sample.
The fundamental structure of the data attached to any single unit of analysis includes the values associated with the following variables.
Y – Performance Measurement
– Process Design Factor 1 at Levels
– Process Design Factor 2 at Levels
…
– Process Design Factor M at Levels
PT – Time of Production at T Time Periods
7.1 The Data Understood from an Unstructured Viewpoint
The data structure presented in Figure 7-1 reflects the data viewed from an “unstructured” perspective with respect to the K process design conditions defined by the M process design factors included in the problem formulation. That is, any relationship among the design factors - is ignored, and the K rational subgroups that the combinations of process design factors create are simply “strung out” as K separate process design conditions. A sample of size is collected within ktth rational subgroup as highlighted in Figure 7-1.[28]
7.2 The Data Understood from a Structured Viewpoint
When there are multiple process design factors the process design conditions can also be viewed from a structured perspective. This is often referred to as the analysis of the “factorial structure” of the data. This concept is illustrated in Figure 7-2 for the case of two process design factors with the first factor occurring at 2 levels and the second factor occurring at 3 levels. In this case we have a 2x3 factorial structure associated with the 6 process design conditions, and the effects of the process design conditions can be separated into process design factor effects.
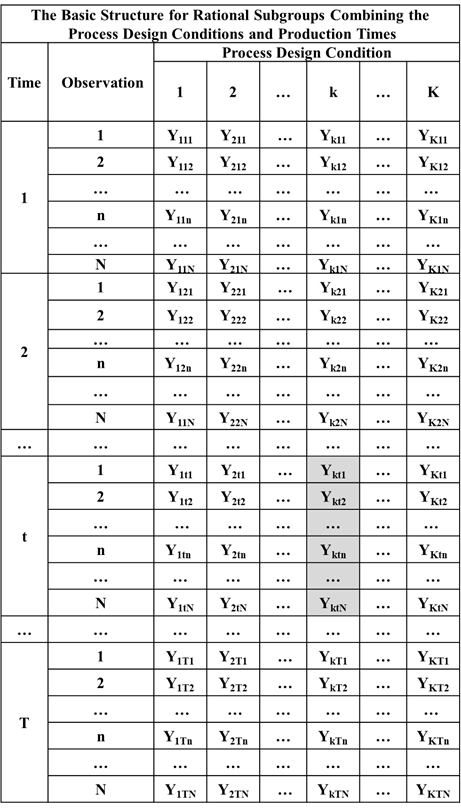
Figure 7-1. The VAS Data Viewed from an Unstructured Perspective
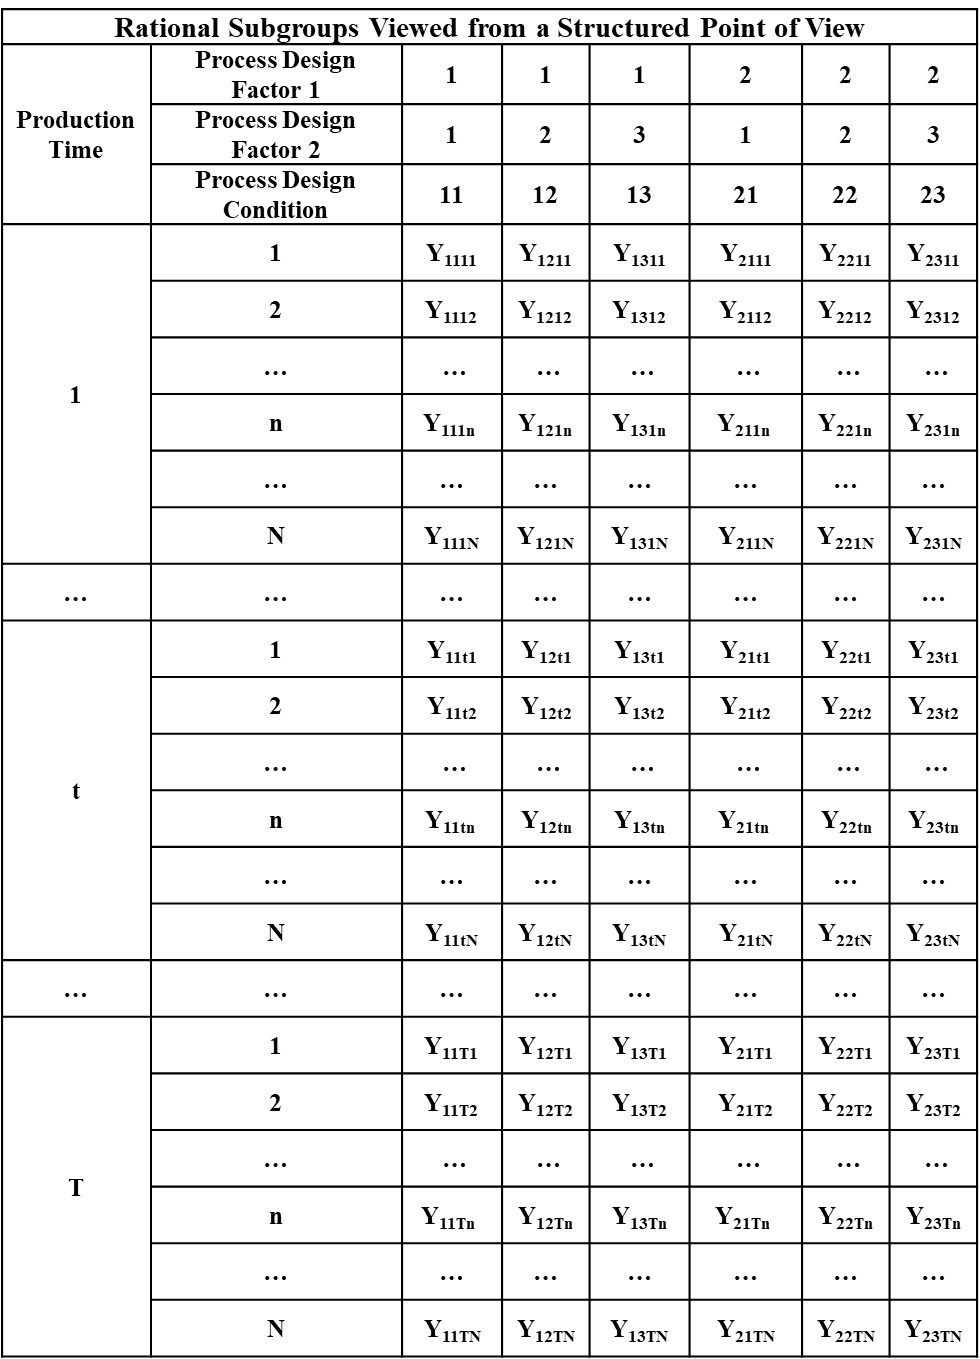
Figure 7-2. The VAS Data Viewed from a Structured Perspective
7.3 An Example of the Rational Subgrouping Methodology
An actual example involving the patient transport process in a large metropolitan hospital illustrates the method of rational subgrouping. There are two process design factors identified in the problem formulation.
– Nursing Floor were the Patient Resides at 3 levels (1, 2, 3)
– Patient Escort Experienced a Problem During Transport at 2 levels (No, Yes)
So there is a total of K = 3x2 = 6 process design conditions. Data were collected over T = 5 days for a total of R = 5x6=30 rational subgroups. A sample of size N = 4 trips was recorded for each rational subgroup. In this case the rational subgroups are being viewed from a structured perspective. The data within the rational subgroups in Figure 7-3 is the time the patient escort spent in the patient’s room preparing the patient for transport to an ancillary testing unit. The data for the rational subgroup defined by “Nursing Floor = 2” and “Problem Encountered = No” for Day = 3 is highlighted.
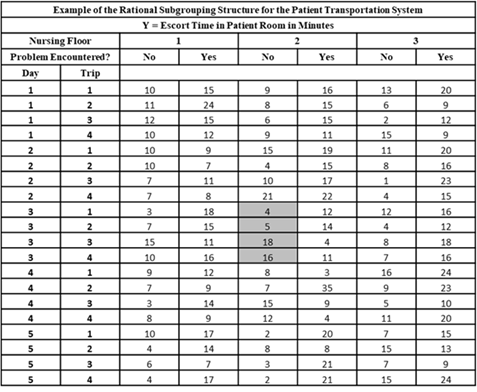
Figure 7-3. The Escort Time in the Patient’s Room
In Figure 7-1 .