8.0 The Statistical Structure for Rational Subgroups
Once the rational subgrouping structure in Figure 7-1 or Figure 7-2 has been created, the starting point for the analysis is based on the initial assumption (to be tested) that the statistical structure associated with the rational subgroups is as presented in Figure 8-1. That is, the data within the ktth rational subgroup are assumed to be produced by a constant cause system associated with a statistical distribution characterized by the density function .[29]
We recognize that this assumption may be incorrect. There may be unexplained assignable causes of variation within and across the rational subgroups creating uncontrolled and unpredictable variation. As noted earlier it is an important, but difficult, inductive problem to determine if it is reasonable to believe that the data within the rational subgroups are being produced by a statistical distribution. We depend upon our use of a rigorous problem formulation strategy to provide support for the use of this assumption as a reasonable starting point in our analysis. Various analyses, particularly the analyses of the subgroup standard deviations, conducted by VAS that are explained in later chapters test this assumption.
8.1 The Application of the Concept of “Essential Information”
Even when the assumption that the statistical structure of the data as presented in Figure 8-1 is true in fact, the exact forms for the density functions are hardly ever known in practice. But recall that the vast majority of the “essential information” about the distribution is captured by the rational subgroup mean and the standard deviation . Therefore the reference statistical structure describing the data relevant to VAS is presented in Figure 8-2. From this perspective the fundamental task of analyzing the data produced by a general cause system of variation depends on analyzing the behavior of the rational subgroup means and standard deviations across the rational subgroups.
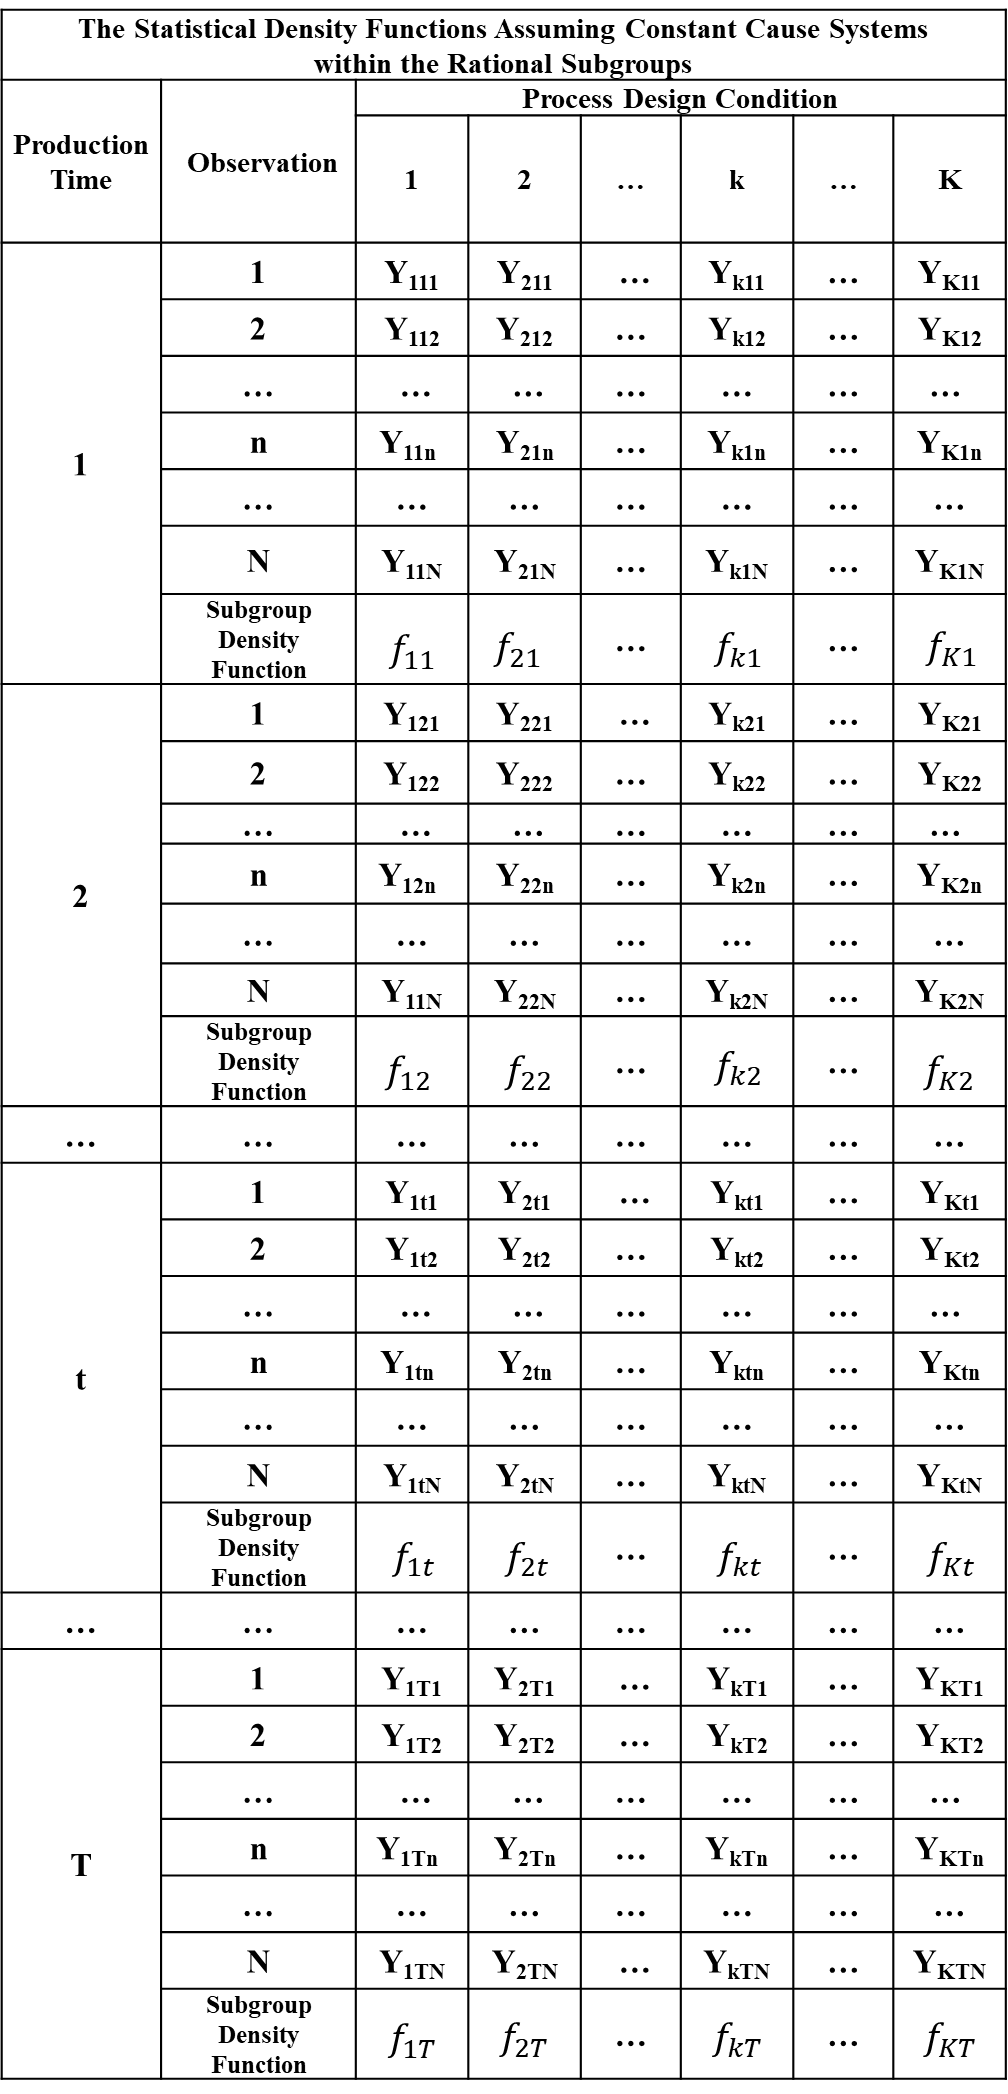
Figure 8-1. RSG Statistical Structure for Constant Cause Systems
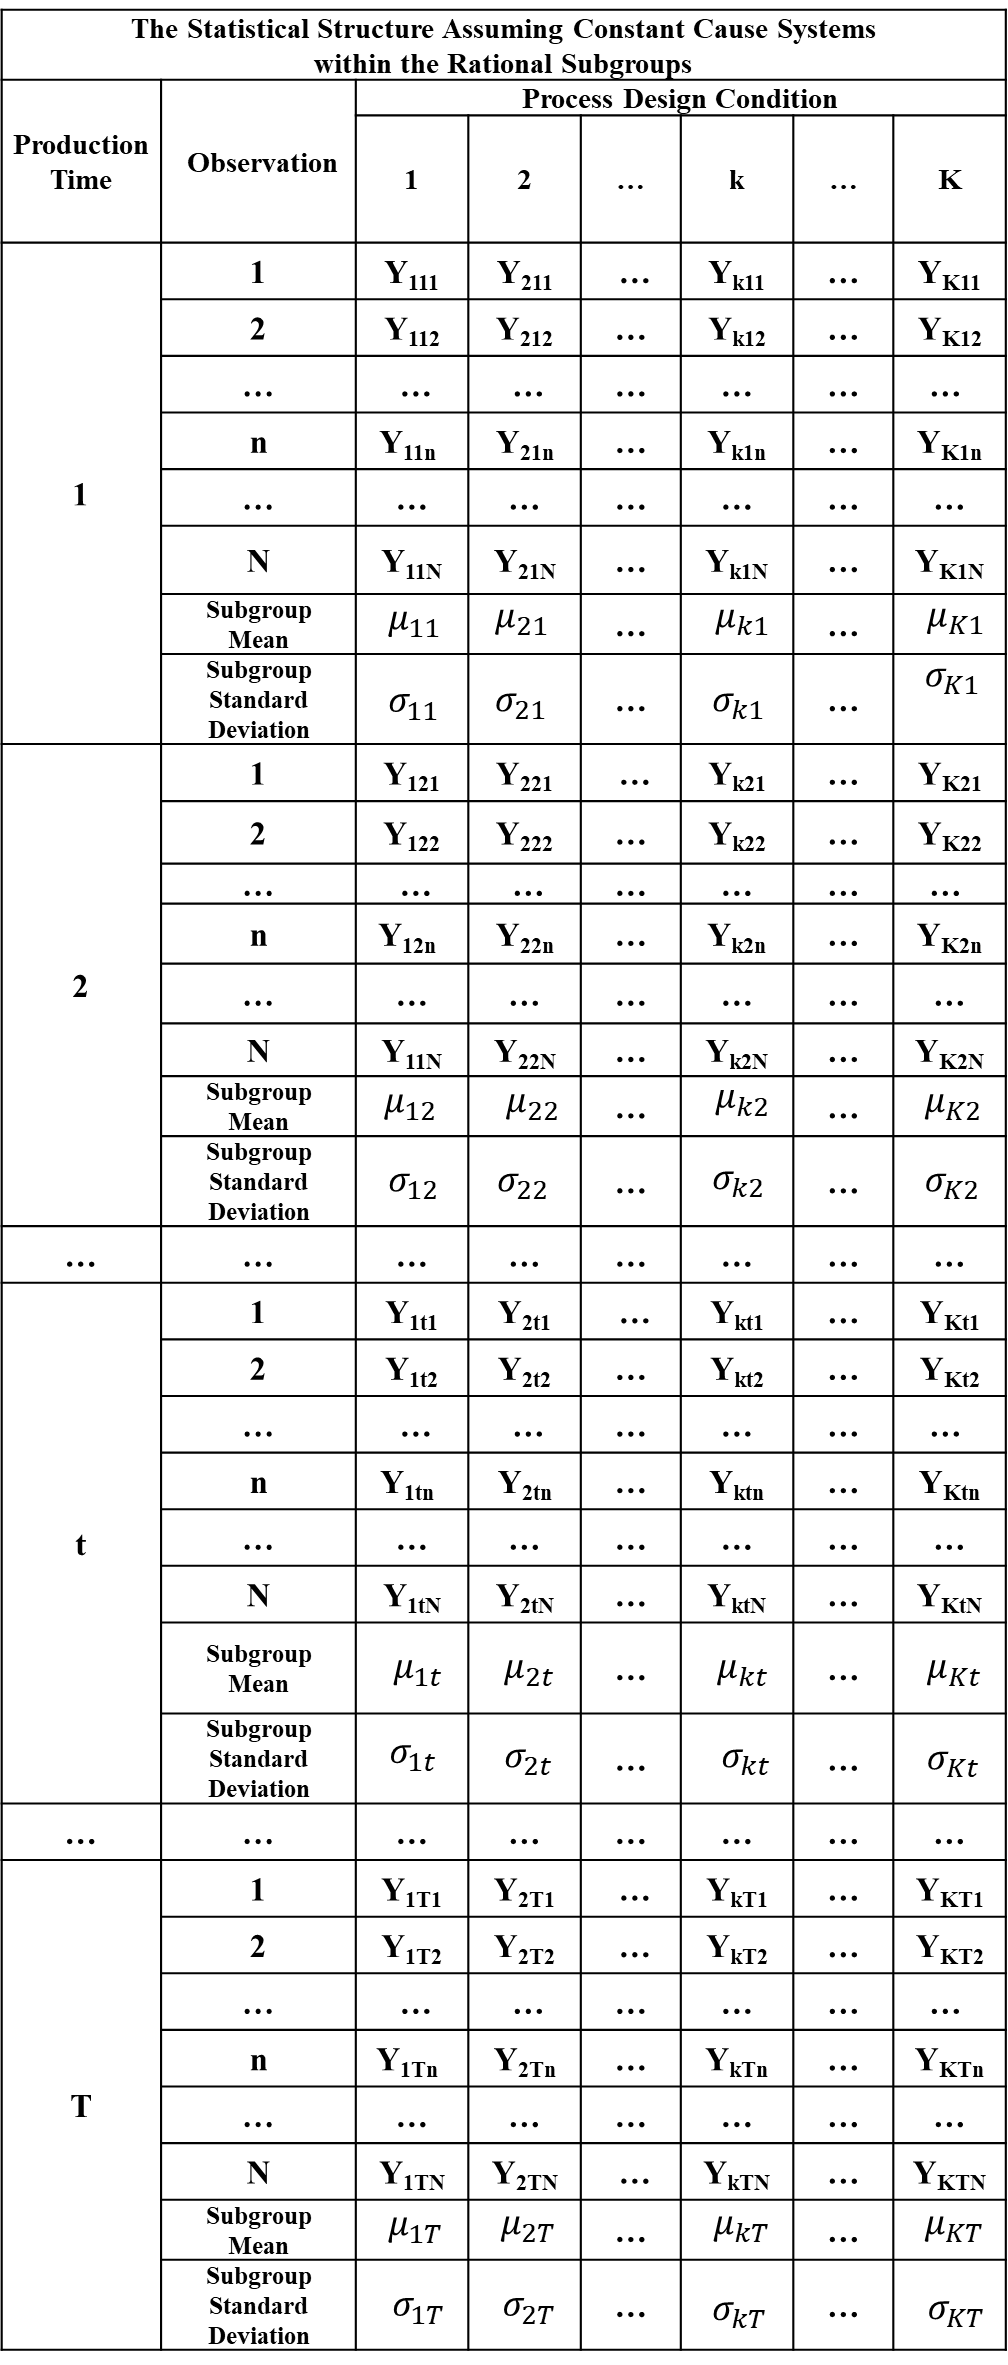
Figure 8-2. The Essential Information Related to the Rational Subgroups
The classical statistical models used by analysts often make additional specific assumptions about the form of the density functions. For example, in linear model theory it is often assumed that . Note, in this case it is assumed that the standard deviation σ is common to all of the rational subgroups.