13.0 The Three Analytic Design States
Recall the fundamental structure of the data available for analysis by VAS, and the six “sampling design states (SDS)” associated with that structure which have been described in Chapter 9 and are presented here again in Figure 13-1 and Table 13-1 for convenience.
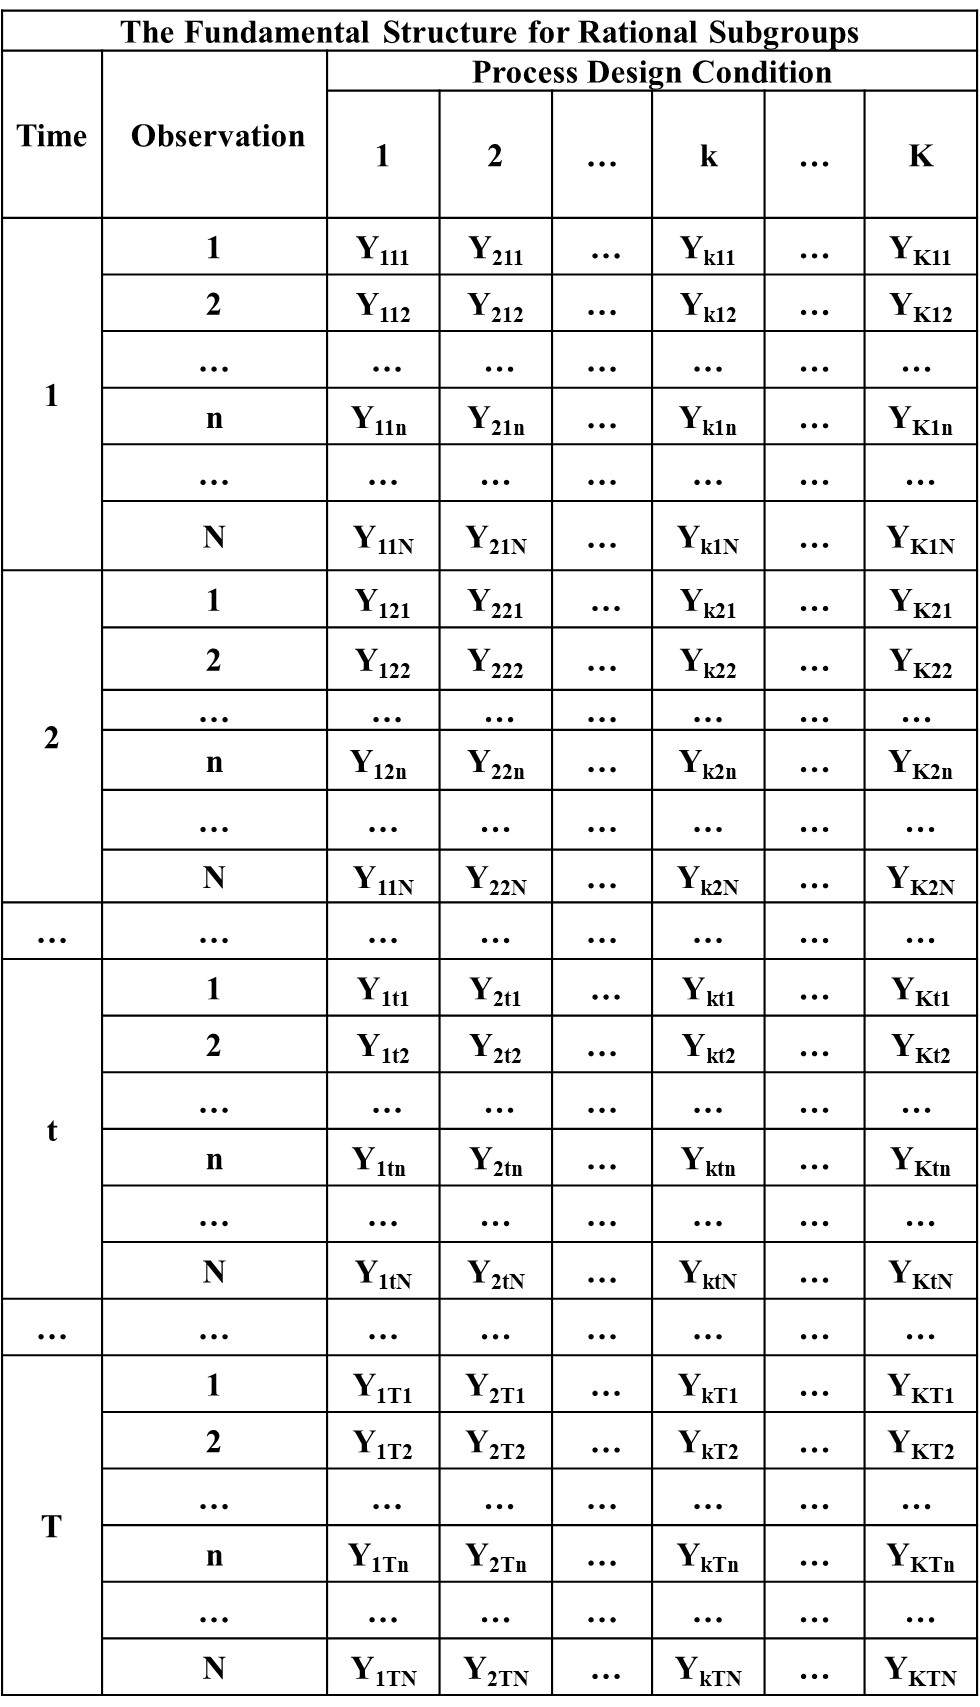
Figure 13-1. Fundamental Structure of VAS Data
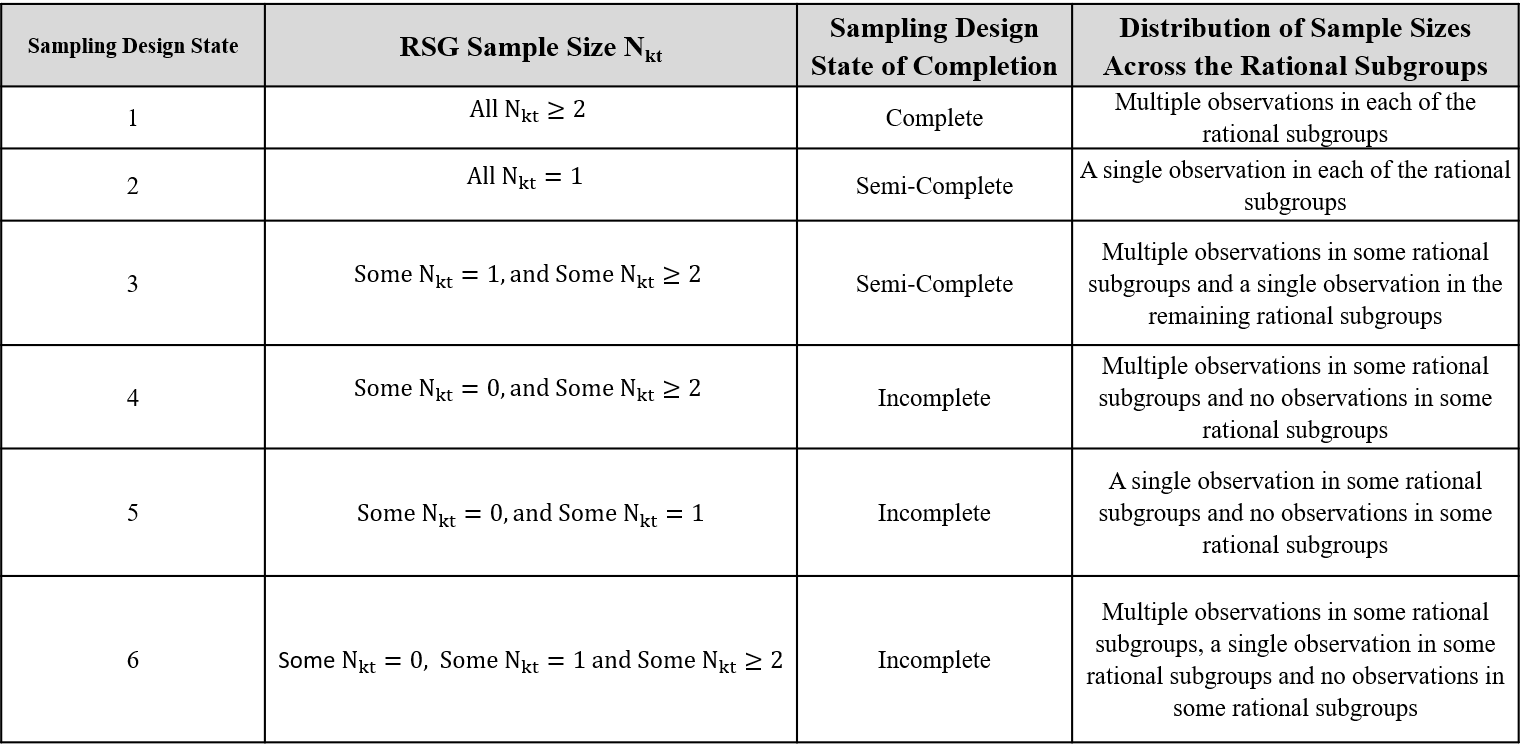
Table 13-1. The Six Sampling Design States
It will be seen in the following chapters that process behavior charts are used in to answer specific questions regarding the cause system under study. In order to do this the data in Figure 13-1 are adjusted in the form of the “R residuals” which are organized into specific rational subgrouping structures that form the basis for the analyses. The generic structure of these rational subgroups is presented in Figure 13-2.
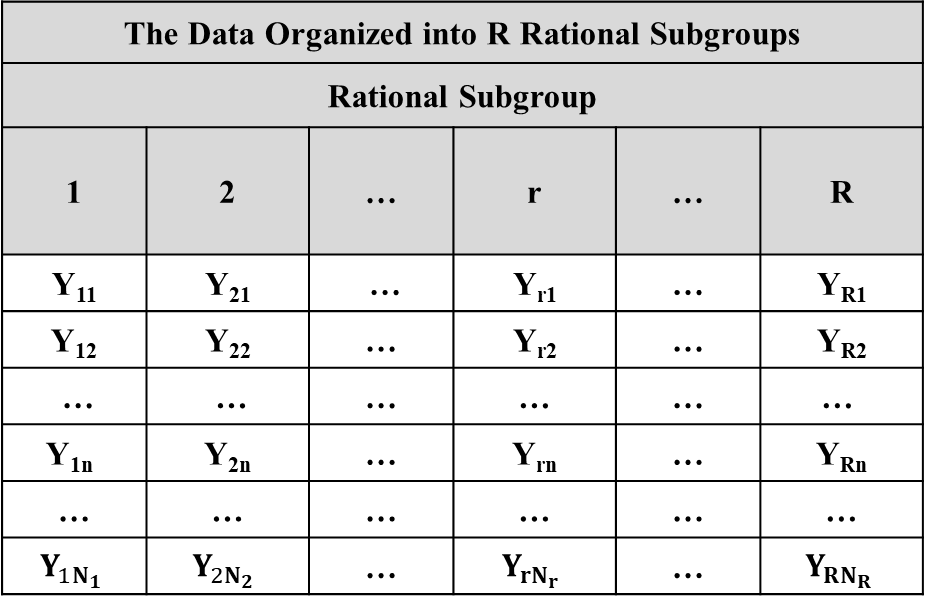
Figure 13-2. The Generic Structure of Data Organized into R Rational Subgroups
The choice of the process behavior charts that should be used for the analysis of data organized as in Figure 13-2 depends upon the distribution of the values of the rational subgroup sample sizes across the rational subgroups. There are three possible distributions for the actual observed data presented in Table 13-2. Because these distributions determine the appropriate process behavior charts that should be used for the analysis they are referred to as the “analytic design state (ADS)”.
As can be seen, the choices are fixed for the analytic design states 1 and 2. But analytic design state 3 deals with a “mixture” of samples size and which is a “semi-complete” state associated with “sparse” data. In this case VAS uses either the Xbar/S or ImR charts depending upon what analysis is being conducted.
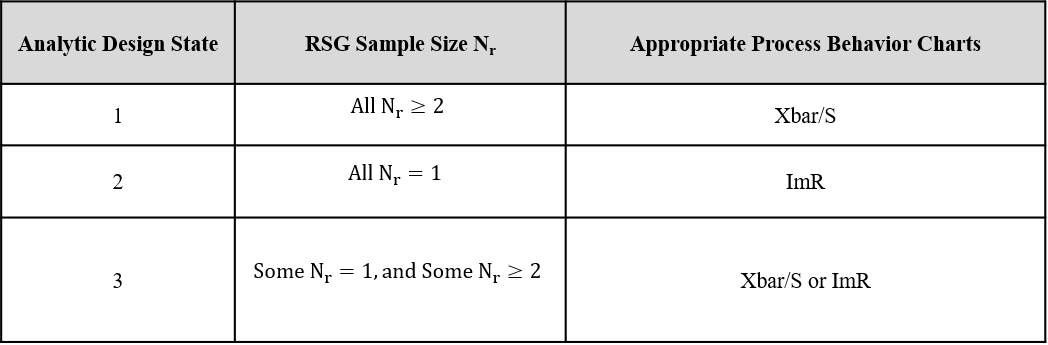
Table 13-2. The Three Analytic Design States and Appropriate Methods of Analysis
13.1 The Mapping of the SDS to the ADS
For reference, the rational subgrouping structures associated with the six sampling design states (SDS) map into the three analytic design states (ADS) according to Table 13-3.
Table 13-3. Mapping of SDS into ADS
| Sampling Design State (SDS) | |||||||
|---|---|---|---|---|---|---|---|
| 1 | 2 | 3 | 4 | 5 | 6 | ||
| Analytic Design State (ADS) | 1 | X | X | ||||
| 2 | X | X | |||||
| 3 | X | X | |||||